ASO Timeline: A 12-Week Post-Launch Plan (2026)
TL;DR. This ASO timeline is a 12-week operating plan, not a promise that Apple will rank an app by a particular day. Save a clean baseline before launch, diagnose the weakest step in your acquisition funnel during weeks 1 to 4, ship one evidence-backed change in weeks 5 to 8, and run a Product Page Optimization test in weeks 9 to 12 only if the test has enough traffic. Apple does not publish a universal keyword-indexing or ranking schedule.
Last updated: September 24, 2026.
Disclosure. We make ScreenFast, an App Store screenshot generator. It helps create visual variants for one part of this plan. It does not choose keywords, change App Store metadata, or guarantee rankings.
The 12-week ASO timeline at a glance
| Period | Main question | Deliverable |
|---|---|---|
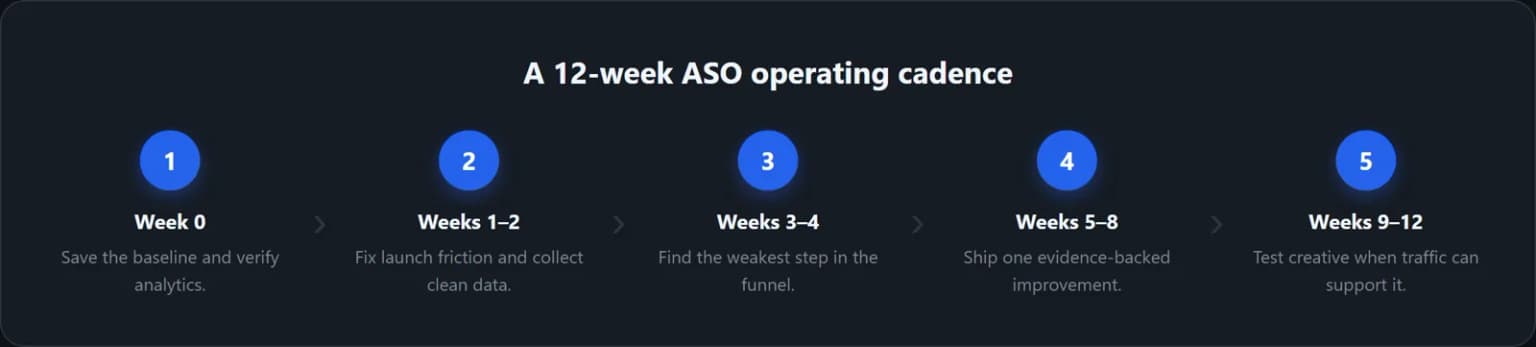
| Week 0 | Can we measure the full funnel? | Baseline dashboard and saved listing |
| Weeks 1-2 | Is anything broken or misleading? | Launch QA and issue log |
| Weeks 3-4 | Where does the funnel lose people? | One prioritized hypothesis |
| Weeks 5-8 | Did one controlled change help? | Before-and-after readout |
| Weeks 9-12 | Can traffic support a creative test? | PPO test or a documented reason to wait |
Treat these windows as a decision cadence. A low-volume app may need longer to gather useful evidence. A high-volume app may be able to test sooner. Calendar time alone is not proof.
Week 0: save a baseline before release
Do not wait until a metric moves to decide what it used to be. Before launch, save the exact product page and the measurement setup you will compare against.
Your baseline pack should contain:
- The app name, subtitle, keyword field, primary category, description, icon, screenshots, previews, and every localization.
- A copy of the first three screenshots in their published order.
- App Store Connect Analytics views for impressions, product page views, total downloads, first-time downloads, and conversion rate.
- Source filters for App Store Search, App Store Browse, app referrers, and web referrers.
- Product metrics that matter after the download, such as activation, trial starts, purchases, retention, crashes, and deletions.
Apple defines App Store conversion rate as total downloads and pre-orders divided by unique device impressions. Product page views are a separate metric, so do not describe conversion as simply "page views to installs." Use the current definitions in App Store Connect Analytics and keep the formula next to your dashboard.
Run the App Store listing optimization checklist once before release. It catches missing fields and visual inconsistencies that would otherwise pollute the first weeks of data.
Weeks 1-2: fix friction, not rankings
The first two weeks are for quality control. Confirm that the released version, pricing, availability, localizations, screenshots, links, purchases, and onboarding match what you intended. Check App Store Connect by territory and device instead of relying on a blended total.
Respond immediately to concrete failures: crashes, broken purchases, misleading screenshots, the wrong localization, or a support link that does not work. Those are product or listing defects, not ASO experiments.
For everything else, record the signal before changing the page. Apple says App Store search uses text relevance, including the app title, subtitle, keywords, and primary category, plus customer behavior such as downloads, ratings, and reviews. That makes discovery, conversion, and product quality connected, but it does not mean every early fluctuation requires a metadata rewrite. See Apple's current App Store search guidance.
Set up a respectful review prompt at a genuine success moment. Apple recommends asking after a completed action and avoiding interruption at launch. The system prompt can appear to a person no more than three times within 365 days, and users can disable it. The practical goal is not "review velocity." It is to ask satisfied, experienced users at an appropriate moment. Apple's StoreKit review guidance explains the constraints.
Weeks 3-4: diagnose the weakest funnel step
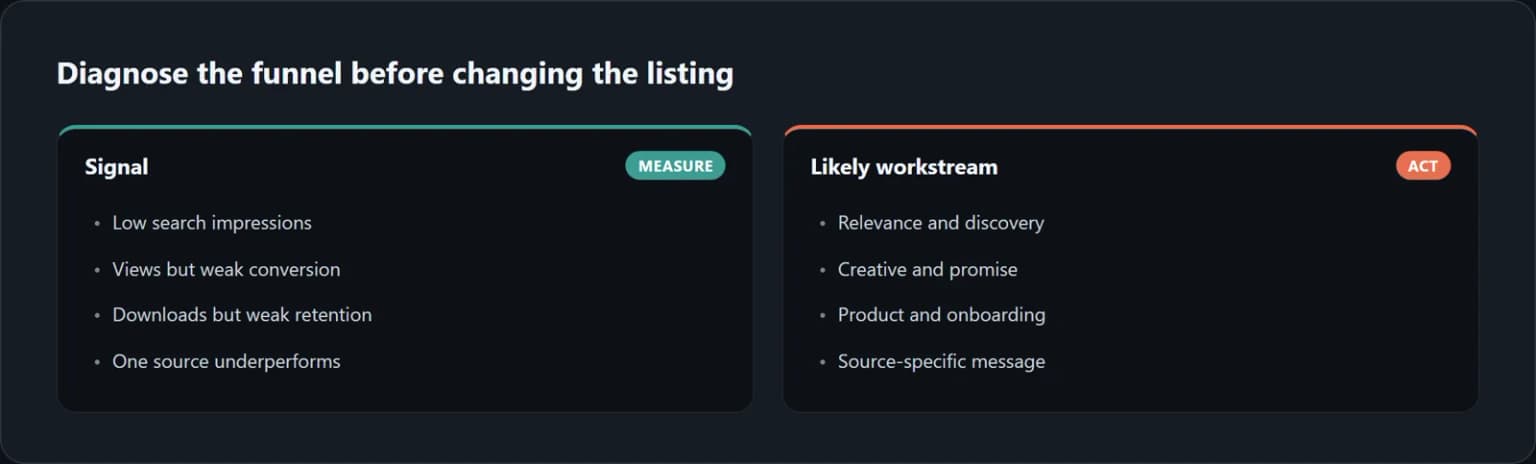
Now turn observations into one prioritized problem. Start with the funnel, then segment it by source, territory, device, and product page where volume allows.
| Pattern | First investigation | Do not assume |
|---|---|---|
| Low App Store Search impressions | Relevance of name, subtitle, keywords, category, and localized metadata | That screenshots caused a discovery problem |
| Impressions but few page views | Icon, title, subtitle, rating, first visible assets, and query intent | That the long description is the first fix |
| Page views but weak downloads | Promise clarity, screenshot sequence, reviews, pricing, and trust | That adding more keywords will improve conversion |
| Downloads but weak activation or retention | Onboarding, performance, product promise, and traffic quality | That the listing alone can fix the product |
| One source is weak | Message and creative for that source | That the global average applies to every source |
Apple's Analytics dashboard can break acquisition out by source and product page. Some usage data may be unavailable when volume is below privacy thresholds or users have not opted in to share diagnostics. Treat a blank cell as missing evidence, not a zero. The Analytics overview documents the available views and privacy limits.
If search relevance is the bottleneck, build a focused semantic map before editing the listing. Our ASO keyword research guide explains how to separate broad discovery terms from high-intent feature phrases. Apple limits the keyword field to 100 characters and advises against repeating words already used in the name, subtitle, or category.
End week 4 with one sentence: "For this audience and source, changing X should improve Y because Z." If you cannot write that sentence, you are not ready to ship an ASO change.
Work through one diagnosis before changing assets
Consider a fictional planning app after launch. Search impressions are present, but product page views from that source are weak. The team proposes new screenshot colors. That might be premature: in some search layouts the title, icon, rating, and visible assets affect whether a person opens the page, and traffic intent matters too. First inspect the actual search presentation and the queries or campaigns bringing visitors. Then check whether the first visible screenshot explains the job.
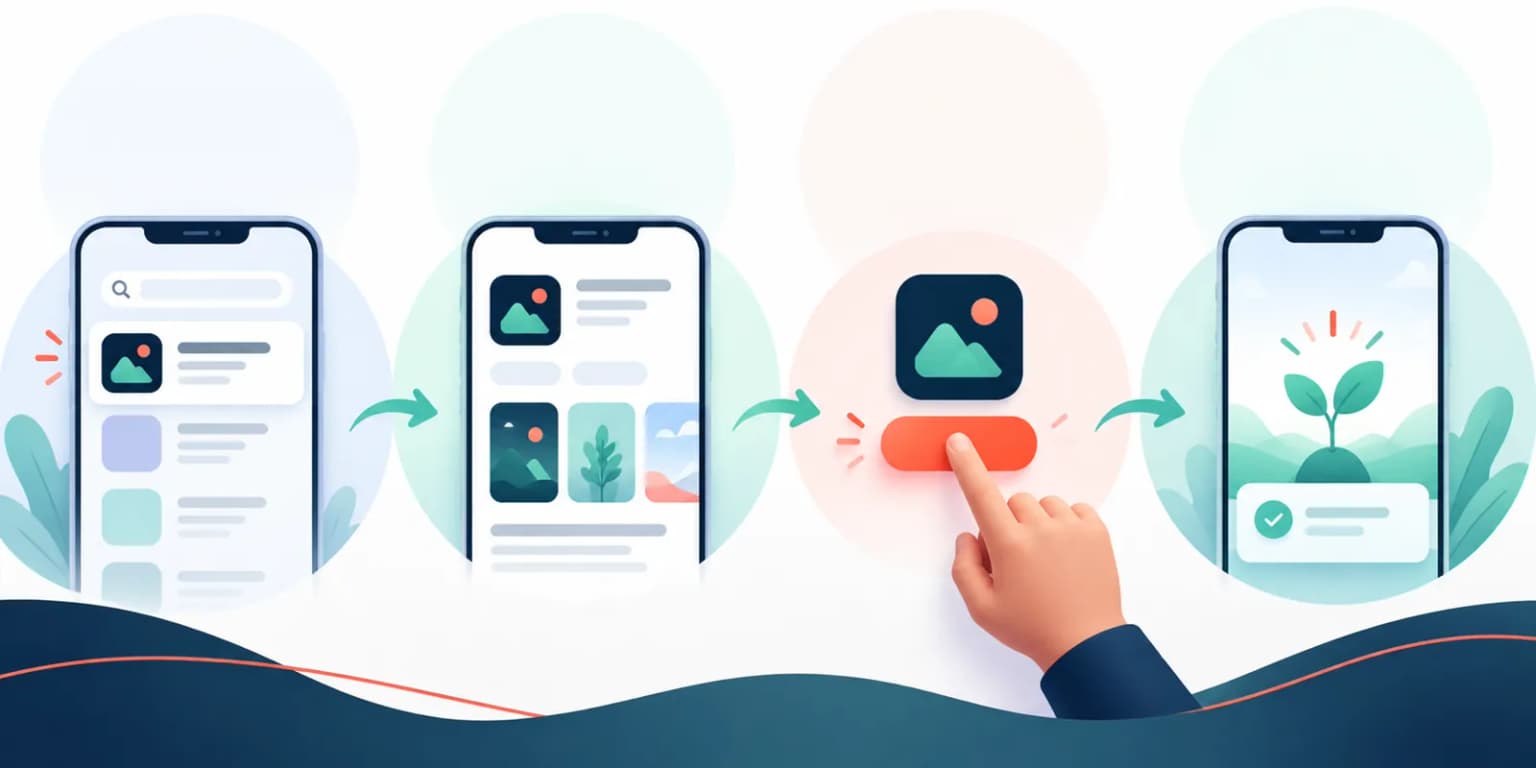
The diagram shows stages, not measured drop-off or a predicted growth curve. Write the diagnosis as a decision log:
| Field | Example entry for the fictional app |
|---|---|
| Audience and source | New visitors from App Store Search |
| Observed weak step | Search impression to product page view |
| First check | Search result promise, icon, title, first visible asset, query fit |
| Candidate change | Clarify the first visible benefit only if the mismatch is real |
| Guardrail | First-time downloads and activation do not deteriorate |
If the weak step is instead download to activation, a prettier store image could make the numbers look better while attracting more users who leave. Fix the product promise or onboarding before scaling acquisition. This example is a method for asking better questions, not a case study or a threshold that every app must meet.
Weeks 5-8: ship one controlled improvement
Choose the workstream supported by the diagnosis. Do not bundle a new icon, new screenshot story, new keywords, new pricing, and new onboarding into one release and then claim you learned which item worked.
A useful iteration brief contains:
- The audience and acquisition source.
- The observed problem and date range.
- One primary outcome metric.
- One guardrail metric, such as retention or proceeds.
- The exact fields or assets that will change.
- A comparison window and a written decision rule.
Some App Store fields can be edited only while the app is in an editable state or with a new version, while others can be changed at any time. Check Apple's current property matrix before planning the release. Apple also notes that updated app information can take up to 24 hours to appear in some storefronts, so timestamp the actual live change before measuring it.
When creative is the bottleneck, rewrite the first screenshot as a clear value proposition before polishing the rest. The first frame should state who the app is for or what outcome it creates, while the following frames prove the claim with real product moments. Use the screenshot size reference to avoid production errors.
Do not judge the result from one unusually strong day. Compare similar weekdays, separate paid and organic sources where possible, and note other releases, promotions, featuring, seasonality, or outages that could explain the movement.
Weeks 9-12: test screenshots when the data supports it
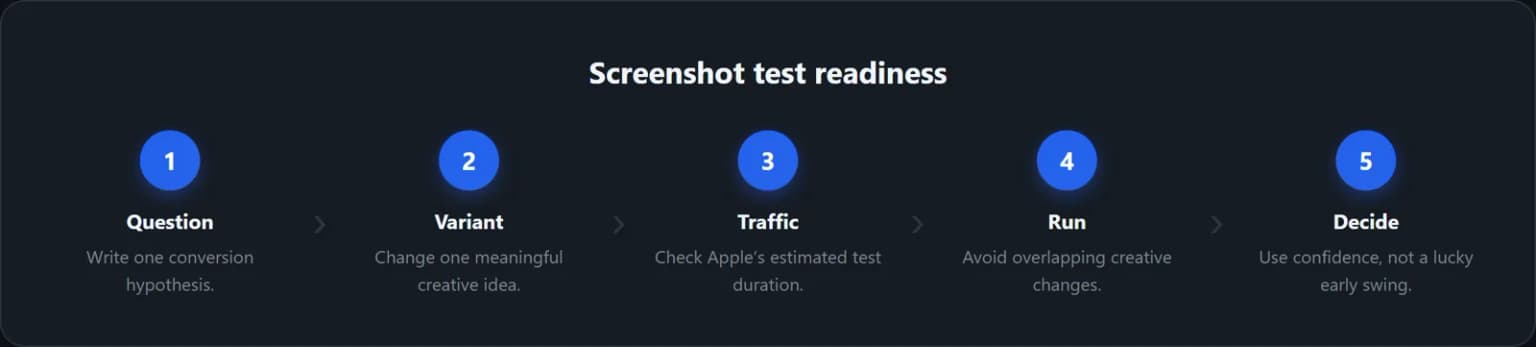
Product Page Optimization can test alternate screenshots, app previews, and icons. Apple provides up to three treatments, and a test runs for up to 90 days unless you stop it earlier. Results appear after at least five first-time downloads are attributed to the test, but that minimum does not make the result conclusive.
In the current Analytics experience, Apple labels a treatment Performing Better or Performing Worse at 90% confidence. Low-traffic tests can be marked Likely to be Inconclusive. Use the estimated test duration before launching, test a meaningful contrast, and avoid overlapping changes that make attribution impossible. Read Apple's PPO result guidance before choosing a winner.
A good first screenshot hypothesis is specific:
Showing the completed outcome in frame one will improve conversion from App Store Search because the current feature-led frame does not communicate the result.
A weak hypothesis is "make the screenshots better." It does not define an audience, a change, or a reason.
If traffic cannot support PPO, do not manufacture certainty from a tiny sample. Make the strongest evidence-backed control you can, document the change, and wait for more volume. When you are ready, use the App Store screenshot A/B testing guide to structure the experiment.
The weekly scorecard to keep
Use one row per week and retain the source-level breakdowns behind it.
| Field | What it tells you |
|---|---|
| Unique impressions by source | Whether discovery changed |
| Unique product page views by source | Whether people opened the listing |
| Total and first-time downloads | Whether acquisition changed |
| Conversion rate by source | Whether the listing converts its traffic mix |
| Rating and review themes | What users praise or misunderstand |
| Activation and retention | Whether acquired users receive the promised value |
| Proceeds or paid conversion | Whether growth reaches the business outcome |
| Changes and external events | What could explain the numbers |
Use peer group benchmarks as context where Apple provides them, not as a universal target. Your own source, territory, device, price, and category mix determine whether a blended benchmark is useful. The most valuable comparison is usually the same app, same segment, and comparable period before and after one documented change.
Where ScreenFast fits in the timeline
ScreenFast belongs in the creative-production step, not in the measurement or keyword-research steps. Paste an App Store URL or start a new project to receive an audit. After the one-time checkout, ScreenFast creates 10 visual directions so you can choose challengers without designing each concept from scratch.
Use it after the diagnosis identifies a screenshot problem:
- Write the audience, source, and hypothesis first.
- Generate distinct visual directions, not ten cosmetic color swaps.
- Keep the product promise accurate.
- Select one challenger for a controlled test.
- Measure conversion and downstream quality together.
Start with the App Store screenshot generator when your scorecard points to creative, not when the real issue is crashes, onboarding, or irrelevant traffic.
How we tested
We rechecked Apple's current App Store search, Analytics metric definitions, metadata property matrix, StoreKit review-request guidance, and Product Page Optimization documentation on September 24, 2026. Apple documents the available signals and testing system. It does not publish a universal number of days for keyword indexing, ranking stabilization, or an automatic "launch boost." The new planning-app diagnosis and funnel visual are fictional. This article presents a repeatable operating cadence, not a claim that every app will rank on the same schedule.
FAQ
How long does ASO take to work?
There is no universal Apple-published timeline. The answer depends on existing traffic, keyword competition, territory, product quality, creative, and how large the change is. Use enough data to diagnose one bottleneck, then evaluate one controlled change.
Does Apple give every new app a seven-day ranking boost?
Apple does not document a guaranteed seven-day boost. A new app can experience volatile early visibility, but you should not build a plan around a fixed "Seven Day Cliff" as if it were an official rule.
How often should I change App Store metadata?
Change it when you have a clear hypothesis and enough comparable data to evaluate the previous version. Check Apple's property matrix because some fields require an editable app version or a new submission. Avoid changing several unrelated fields at once.
Which ASO metric should I watch first?
Start with the weakest stage of the funnel. Search impressions diagnose discovery, product page views show listing visits, conversion rate connects unique impressions to downloads, and activation or retention tests whether the product fulfills the promise.
When should I run a Product Page Optimization test?
Run one when you have a specific creative hypothesis and enough traffic for Apple's estimated test duration to be practical. Do not choose a winner from an early swing. Apple uses a 90% confidence threshold for its Performing Better and Performing Worse labels.
What should a low-traffic indie app do instead of A/B testing?
Use source-level analytics, user feedback, competitor patterns, and clear creative principles to select a stronger control. Document the change and keep collecting traffic until a formal test becomes viable.
Can better screenshots fix poor retention?
No. Screenshots can improve message clarity and acquisition conversion, but they cannot repair onboarding, crashes, pricing mismatch, or weak product value. In fact, a misleading creative can attract the wrong users and make downstream quality worse.