App Store Screenshot CTR Benchmarks: What to Measure in 2026
TL;DR
Apple does not publish an official App Store screenshot CTR or screenshot scroll-rate metric. In App Store Connect, measure impressions, product page views, first-time downloads, and Apple's defined Conversion Rate, then segment by source and territory. A 2025 US dataset published by AppTweak in 2026 reports 8.56% product-page conversion and 3.8% direct install rate under its own definitions. Neither number is a universal target, and neither isolates the effect of screenshots. Use Apple's peer-group benchmarks and Product Page Optimization (PPO) to test your creative.
First, name the denominator
The term screenshot CTR is used loosely for at least three different things. If two reports use different denominators, comparing their percentages will mislead you.
| Question | Working calculation | What it can tell you |
|---|---|---|
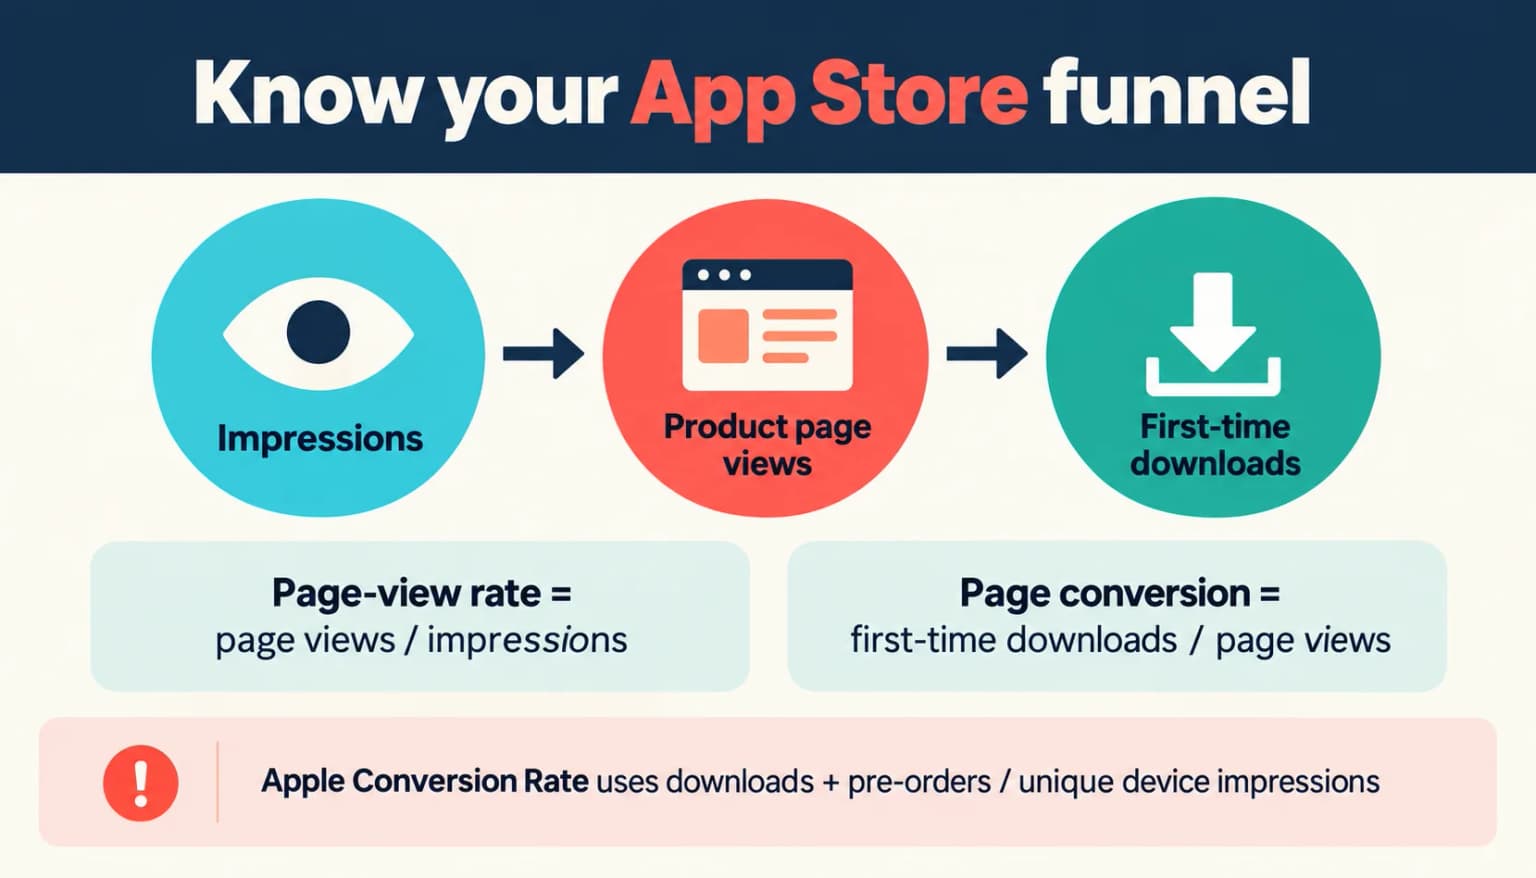
| Do people open the listing? | Product page views / impressions | A directional page-view rate, not a clean click-through metric: Apple says impressions include product page views, and counts can include repeated views. |
| Do page visitors download? | First-time downloads / product page views | A page-conversion proxy; direct installs and repeat page visits can make the numerator and denominator imperfectly matched. |
| Do shown listings generate downloads? | Downloads / impressions | An impression-to-download proxy. State whether downloads means first-time or total, and whether impressions means all or unique devices. |
| What does Apple call Conversion Rate? | Total downloads plus pre-orders / unique device impressions | Apple's native definition. It is not the same as page views to first-time downloads. |
These definitions come from Apple's App Store Connect metric reference. Apple documents impressions as views for more than one second on the Today, Games, Apps, and Search tabs, including product page views. Product page views include pages loaded with StoreKit. No Apple metric in that reference counts swipes between screenshot positions, so a claim such as "17% reached screenshot five" needs separate, independently verifiable instrumentation.
A worked example you can reproduce
Suppose a report shows 20,000 impressions, 1,800 product page views, and 180 first-time downloads in the same date range. The directional page-view rate is 9%; page-views-to-first-downloads is 10%; first-downloads-to-impressions is 0.9%. These are three different rates, not three estimates of screenshot CTR. If Apple also reports redownloads or pre-orders, its native Conversion Rate may differ again. Keep the territory, source, and time window identical when you calculate any of them.
Run the same check on your own app. Write the date range at the top of a sheet. Put one source in each row. Use the same market for each row. Label each formula in plain words. Save a copy before you change the listing. This gives you a clean baseline. It also helps you spot a mix shift. A new ad can bring many cold views. The top-line rate may fall even as the app wins more paid users. In that case, the lower rate alone is not a sign of bad art.
An App Store conversion rate benchmark should name its sample and denominator. An App Store screenshot conversion rate is not a metric Apple defines. A product page conversion rate can be useful if its numerator is clear. An impression to install rate has a different base. An App Store screenshot A/B test is how you can isolate a creative change in your own traffic.
What the 2026-published US benchmark actually says
AppTweak's category study, published in 2026 using 2025 US data, reports an average 8.56% App Store product-page conversion rate and 3.8% direct install rate. AppTweak defines its page rate using first-time app units divided by product page views; its direct rate uses direct app units divided by impressions. Those are AppTweak's measures, not Apple's default Conversion Rate. The study also shows substantial category variation, so the average can be a poor comparator for your app.
Treat the figures as context rather than an action threshold. A low rate does not prove screenshots are at fault: traffic intent, app name, icon, ratings, pricing, product-market fit, and source mix can all change the result. A product page reached from a branded search is not comparable to a cold generic query or a social campaign. Apple's peer-group benchmarks provide percentile comparisons across relevant peer sets; start there and compare your own cohorts over time.
Subscription monetization is a different funnel. For example, Adapty's 2026 subscriptions report describes install-to-trial and trial-to-paid behavior across its app sample. Do not put a trial-to-paid figure into an App Store screenshot benchmark table. That would obscure the actual conversion step you are trying to improve.
Which screenshot can influence which step?
Search-result presentation varies by device, layout, content, and app preview availability. Apple's product page guidance says the first one to three screenshots may appear in search results when there is no app preview. That makes the beginning of the sequence especially important, but it does not establish that three screenshots cause 80% of downloads or that every visitor sees all three.
Use a simple narrative that can be tested:
- First frame: make the primary benefit understandable at thumbnail size, with real app UI as evidence.
- Second frame: show the action or feature that delivers that benefit.
- Third frame: resolve a common objection or show a second meaningful use case.
- Later frames: provide breadth for people who inspect the full listing; do not assume a universal scroll rate.
The first-versus-second screenshot guide explains the tradeoff in depth. For layout examples, use our App Store screenshot design patterns. Our typography test shows how headline size survives thumbnail reduction.
Diagnose the leak before redesigning
Open App Store Connect Analytics and select one territory, device family, source type, and date range. Record impressions, unique device impressions, product page views, Apple's Conversion Rate, first-time downloads, and redownloads. Then ask:
- Impressions are low: your first job may be discoverability or relevant traffic, not screenshot redesign.
- Impressions are healthy but page views are weak: inspect the app name, icon, rating, search-result context, and visible creative. A page-view rate is only a proxy, not proof that the first screenshot failed.
- Page visits are healthy but first-time downloads are weak: inspect the entire listing, especially the promise-to-product match, screenshots, preview, price, reviews, and compatibility.
- Downloads arrive but users do not activate: fix onboarding or product value before buying more traffic.
Segment again after any change. Aggregate conversion can fall simply because a successful campaign added colder visitors. A single top-line percentage cannot distinguish that mix shift from a creative problem.
Run a screenshot test that can answer the question
Apple's Product Page Optimization can compare a default page with alternate treatments for eligible assets. Apple allows a test to run for up to 90 days, but the needed sample and time depend on your traffic and effect size. There is no reliable universal rule such as "1,000 views per week" or "always wait 30 days." Review the test's confidence and results in App Store Connect; do not promote a noisy winner.
Change one coherent hypothesis at a time. For example, compare a benefit-first first frame with a feature-first first frame while keeping the rest of the sequence stable. If you change the icon, copy, screenshot order, and price together, you will not know which part helped. Document the start date, territories, treatments, and outcome before shipping. The screenshot A/B testing guide covers setup and interpretation.
ScreenFast is our product. It provides a listing audit and, after a one-time checkout, ten screenshot design directions to review. It is useful for producing test candidates; it cannot tell you which candidate will win in your App Store traffic. See the generator and pricing, then verify every rendered claim and device detail before upload.
How we tested and sourced this guide
We checked Apple's live metric definitions, screenshot presentation guidance, peer-group benchmark documentation, and PPO instructions on 2026-09-24. We then compared the denominators in AppTweak's 2026-published study of 2025 US App Store data. The 20,000-impression calculation above is an illustration, not ScreenFast customer data. We have no first-party access to an industry-wide screenshot swipe dataset and therefore publish no scroll-rate benchmark or guaranteed conversion lift. ScreenFast's ownership is disclosed above; no affiliate links are used.
Frequently asked questions
Is there an official App Store screenshot CTR benchmark?
No. Apple provides impressions, product page views, downloads, and a defined Conversion Rate, but not a screenshot-specific CTR or per-frame swipe rate. State the formula and data source whenever someone shares a "screenshot CTR."
Is a 3% App Store conversion rate good?
It depends on the denominator, source mix, category, territory, and whether the figure is first-time downloads or Apple's total-downloads-plus-pre-orders Conversion Rate. Compare like with like, preferably against Apple's peer-group percentiles and your own history.
What is a good impression-to-install rate for iOS?
AppTweak reports a 3.8% average direct install rate for its 2025 US sample, published in 2026. That is not a target for every category or traffic source and is not identical to Apple's native Conversion Rate.
What is a good product page conversion rate?
AppTweak reports 8.56% for its 2025 US App Store sample using first-time app units divided by page views. Check your category and Apple's peer-group data before treating that cross-category average as a goal.
Does changing screenshots improve App Store ranking?
Apple does not publish a dependable formula that converts a screenshot-test uplift into a search-position gain. Improved creative may help acquisition, but do not promise a ranking improvement or a two-to-four-week timetable. Measure downloads and retention directly.
What is the average screenshot scroll rate?
Apple's public Analytics metric list does not provide one. A vendor may measure a specific panel or instrument a test, but that cannot be presented as an App Store-wide average without a transparent methodology.
How long should a screenshot A/B test run?
Apple permits PPO tests for up to 90 days. The useful duration depends on the app's traffic and the effect being tested. Use the test results and confidence indicators, and avoid stopping as soon as an early variant looks ahead.
Last updated: 2026-09-24.
Related reading: Full-funnel App Store conversion benchmarks and first versus second screenshot.