App Store Conversion Rate Benchmarks by Category (2026)
TL;DR
There is no universal app store conversion rate benchmark 2026. The number changes with the event you count, traffic source, country, category, and date. Apple's App Store Connect Conversion Rate uses total downloads plus preorders divided by unique device impressions. A third-party product-page conversion rate may instead divide downloads by page views. Do not compare them as if they were the same metric. AppTweak's US App Store analysis of 2025 data, published in May 2026, reports an 8.56% product-page conversion rate and a 3.8% install rate. Those are different measures, not targets for every app. For a decision about your own listing, start with Apple's peer-group benchmarks and then segment your funnel.
Four conversion rates people call "App Store CVR"
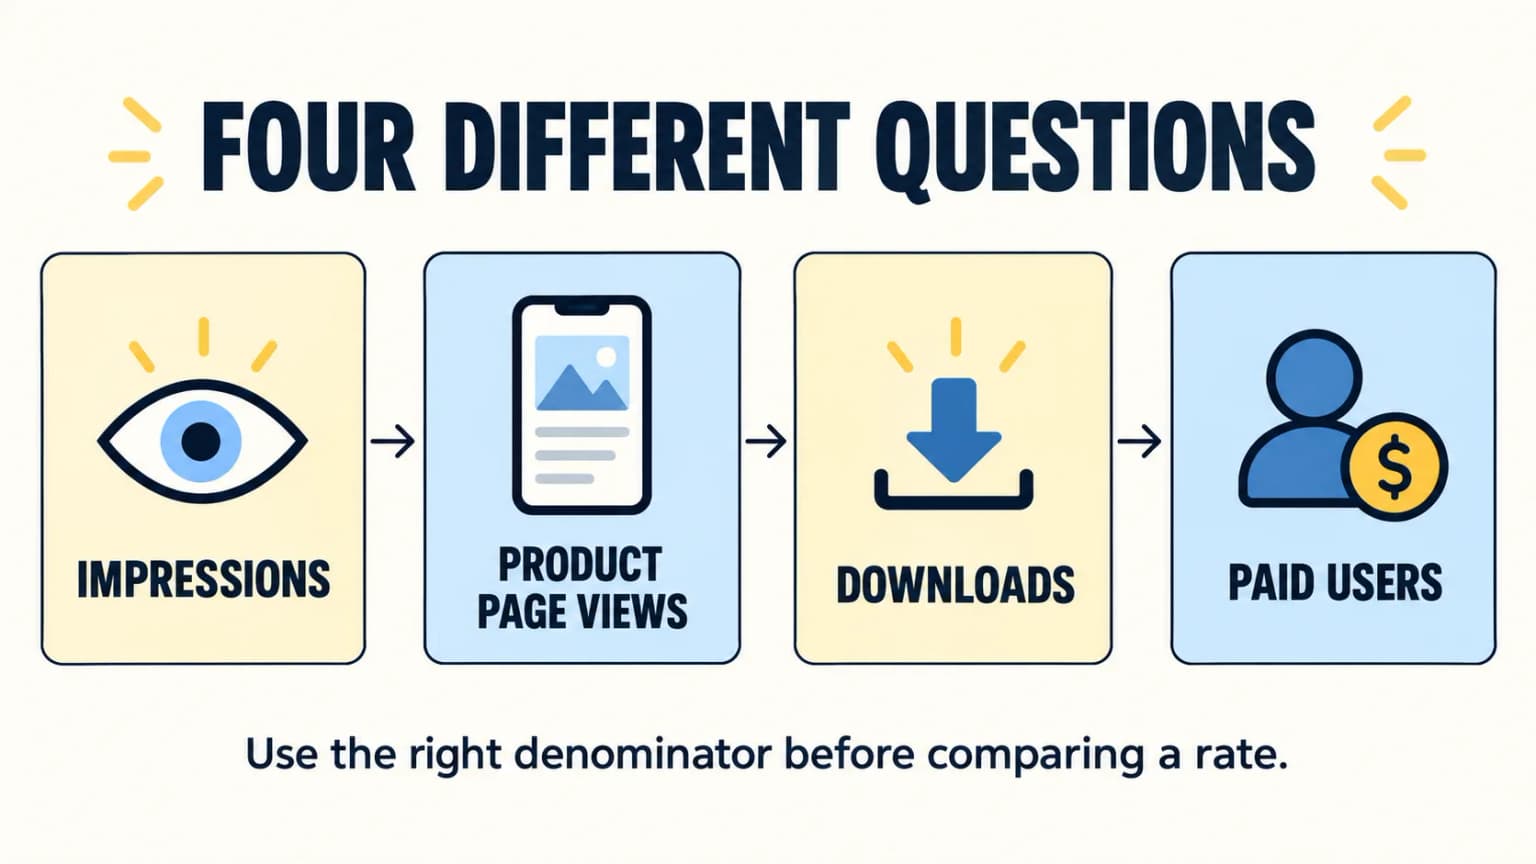
The same phrase often names four different steps. Record the numerator, denominator, time window, and source beside every percentage.
| Question | Example calculation | What it can tell you |
|---|---|---|
| Do people open the product page? | Product page views ÷ impressions | Whether the search result or browse card earns interest. |
| Do impressions become downloads? | Downloads ÷ impressions | How the complete store journey performs. |
| Do page visitors download? | Downloads attributed to page visitors ÷ product page views | How well the page persuades qualified visitors. |
| Do installers become customers? | New paid users ÷ installs | Whether onboarding, pricing, and paywall work. |
Apple's own metric definitions are the source of truth for the number labeled Conversion Rate in App Store Connect. Apple divides total downloads plus preorders by unique device impressions. Total downloads can include redownloads. A view and a download also need not follow one neat, linear path through a full product page. This is why you should not rename Apple's number "page-view-to-install."
For example, suppose a period has 10,000 unique device impressions, 1,800 product page views, and 500 total downloads plus preorders. Apple's displayed conversion rate is 5% (500 ÷ 10,000). Page views divided by impressions is 18%. But 500 ÷ 1,800 is not automatically your true page-view conversion rate: some downloads may happen without a product-page view, and the event populations may differ. Use a report whose attribution and denominator explicitly support that calculation.
Also distinguish first-time downloads from total downloads. A reinstall can change a total-download metric without representing a new customer. Country, device, source, and date filters matter. Apple's analytics dimensions show which cuts you can use before comparing periods.
What the available 2026 benchmark actually measures
AppTweak published its conversion-rate-by-category analysis in May 2026. Its headline values describe US store performance during 2025. They are not measurements of every app in September 2026.
| AppTweak US App Store measure | Reported 2025 value | Interpretation |
|---|---|---|
| Product-page conversion rate | 8.56% | The report's page-view-based measure. |
| Install rate | 3.8% | First-time downloads direct from search or browse results divided by impressions, per AppTweak. |
| Food & Drink product-page conversion rate | 52.8% | A category value, not a cross-category target. |
| Games-Trivia product-page conversion rate | 5.2% | A different category and intent mix. |
The gap between Food & Drink and Games-Trivia is exactly why a single "good iOS CVR" is a poor decision rule. A user searching for a restaurant's known app arrives with different intent from a user browsing games. Even within one category, brand search, paid traffic, editorial features, and seasonal bursts can alter the mix.
Why developer anecdotes disagree
In a developer discussion, one commenter wrote, "I'd consider 6% as above average" while another asked about market and traffic context. A separate new-app post reported "0.3% conversion rate and 50 total downloads." These are individual dashboards, not a sample from which to calculate an industry average. Their disagreement illustrates why metric definitions and acquisition cohorts come first.
Use this table as published context. AppTweak calls its install rate the share of search or browse impressions that lead to a direct first-time download without a page visit. It is not Apple's total-download Conversion Rate. Do not compare Apple's App Store Connect Conversion Rate directly with AppTweak's product-page rate. Do not turn the 2025 sample into a claim about a fresh 2026 average. We removed older figures that mixed incompatible denominators and secondary reposts.
Find your own category benchmark in App Store Connect
Apple's peer-group benchmarks compare an app with peers grouped by category, business model, and download volume. Apple shows percentile markers, including the 25th, 50th, and 75th percentiles, subject to its privacy rules. This is usually a more useful starting point than a cross-store headline.
- Open App Store Connect → App Analytics → Benchmarks for the app.
- Note the exact metric, period, peer group, and percentile. Check whether enough data is available.
- Compare with your own prior period using the same filters. Mark releases, campaign changes, promotions, and major featuring.
- Segment acquisition by source and country where possible. A sudden blend of low-intent traffic can lower aggregate CVR even when the page has not worsened.
- Track first-time downloads, engagement, and proceeds alongside conversion. A screenshot set that wins installs but attracts the wrong users can damage the business.
Being below a percentile is a diagnostic signal, not proof that screenshots caused the gap. A different price, rating, brand awareness, app quality, or traffic mix may explain it. Apple's peer grouping improves comparability; it does not randomize those differences.
Two apps can show the same rate for different reasons
Imagine two apps both show a 5% Apple Conversion Rate for a week. App A gained most of its impressions from users searching its exact brand name. App B gained most from broad, nonbrand queries. The number alone does not tell you which product page is stronger. App A may have a clearer audience, while App B may be reaching new users who need more explanation. These are hypothetical cases, not reported benchmark data.
Now imagine App B buys a broad ad campaign. Impressions rise quickly, but the rate falls to 3%. That does not prove the new screenshots failed. The denominator now contains a larger share of people with weaker intent. Compare nonbrand US search before and after, then inspect first-time downloads and paid users from that same cohort. If those also fall, you have a stronger reason to test the page. If paid users rise at an acceptable cost, the lower aggregate percentage may not be a business problem.
The practical rule is simple: keep a source-and-country note beside every weekly rate. Annotate product releases and promotions. Avoid treating a change in the mix of visitors as a change in the persuasiveness of one screenshot.
Diagnose the weak step before redesigning
Use the funnel to select a plausible test. Do not infer causation from a single aggregate rate.
| Observation | First things to inspect | Candidate test |
|---|---|---|
| Low page opens relative to impressions | Search intent, icon, title, rating, first visible screenshots | A clearer benefit on the first screenshot; tighter keyword and promise match. |
| Healthy page opens, weak first-time downloads | Full screenshot sequence, price, trust, review themes, preview video | Reorder proof and features; test a new screenshot set. |
| Strong downloads, weak trial starts | Onboarding friction, permissions, first-run value, paywall timing | Improve first successful action before asking for payment. |
| Strong trials, weak paid conversion | Trial cohort, price presentation, cancellation reasons, product value | Test the offer and onboarding with an in-app experiment. |
| Aggregate rate drops after a campaign | Source and country mix, brand/nonbrand split | Compare like-for-like cohorts before changing creative. |
Write down a test hypothesis: For nonbrand US search traffic, a first screenshot showing the finished outcome will improve first-time downloads per eligible impression over the current feature-list version. Define the primary metric and guardrails before launch. Avoid declaring a winner from a handful of downloads.
Apple's Product Page Optimization supports tests of eligible product-page assets. Our screenshot A/B testing guide covers practical setup. Keep each treatment meaningfully different, and review Apple's test result rather than promising a fixed uplift.
Paid Apple Ads conversion is not organic conversion
AppTweak's Apple Ads benchmark study was published with a 2026 title but analyzes 2025 campaigns. The publisher describes a sample of roughly 3,500 apps and 50,000 campaigns. Its US search-results conversion figure is about 55% across campaign types; the published split includes brand, generic, and competitor campaigns.
That rate uses ad taps as its denominator. It is not the App Store Connect organic Conversion Rate and it is not the product-page-view rate in the category table above. Brand ads can convert differently from competitor or generic terms because the user already knows what they want. If paid conversion falls, inspect query and campaign mix before blaming the screenshots.
For an ad creative or store-page test, compare the same placement, geography, query class, and attribution window. Watch cost per acquired customer and downstream value, not just the highest conversion percentage. A higher CVR on expensive brand traffic does not prove a better growth opportunity.
Subscription apps need a second funnel
For a subscription app, an install is not a sale. Adapty's State of In-App Subscriptions report is based on its own 2025 app sample and was published in 2026. Its interactive global view reports roughly 11.2% install-to-trial and 27.8% trial-to-paid. These describe separate downstream steps in that sample; they are not Apple-wide guarantees or directly comparable with AppTweak's page-view rate.
Illustratively, 1,000 installs at those two rates yield about 112 trials and 31 paid conversions. That is arithmetic, not a revenue forecast: free-trial eligibility, attribution, billing, cancellations, and cohort maturity all matter. Inspect your own mature trial cohorts. A trial started yesterday cannot yet contribute to a seven-day trial-to-paid result.
If store CVR is high but paid conversion is weak, more aggressive screenshots may make the mismatch worse. Check that the page promises what the first session delivers. Conversely, if retention and paid conversion are sound but acquisition is weak, page creative may be a higher-leverage test.
A repeatable 30-day measurement plan
Week 1: Export a baseline with the exact App Store Connect metric, country, device, source, and date window. Add first-time downloads, product-page views, trial starts, and paid users from the systems that measure them. Review peer-group percentiles and user reviews.
Week 2: Pick one bottleneck. Audit the first three visible screenshots on the devices and locales that generate the most qualified traffic. Compare claims with the app itself. Draft a treatment with a distinct hypothesis, not only a new color scheme. Our screenshot generator can help produce directions; ScreenFast is our product, so treat this as a tool suggestion, not evidence of a conversion lift.
Weeks 3-4: Run an eligible product-page test or a carefully tracked sequential release if a controlled test is not available. Preserve the source and country cuts. Review the confidence and sample size provided by the testing system. Record results, including null results, and make the next decision from the data.
For the asset step, see our screenshot design patterns. If you are preparing a new release, use the launch checklist to catch metadata and review issues before the test goes live.
Methodology and limitations
This is a synthesis of published primary documentation and vendor-reported datasets, not a new independent benchmark or a hands-on experiment on thousands of apps. Apple defines its own metric and peer groups. AppTweak and Adapty report results from their respective samples and use different funnel events. We state the sample period next to each number. We do not merge these values into a single market average.
Reports may be revised, and a public chart may omit details of attribution or sampling. Before planning a budget, read the linked source's methodology and your own dashboard's metric definition. We do not claim that a particular screenshot edit will produce a fixed percentage gain.
Frequently asked questions
What is a good App Store conversion rate in 2026?
First specify the metric and traffic cohort. Apple's Conversion Rate, a third-party page-view rate, and a paid ad-tap rate are different. Compare your App Store Connect value with its relevant peer group and your own consistent historical cohort. AppTweak's 8.56% US product-page figure describes its 2025 sample, not a universal 2026 target.
Is 3% App Store conversion good?
It may be strong, weak, or incomparable depending on the denominator. A 3% impression-to-download rate is not a 3% page-view-to-download rate. Check whether the numerator includes redownloads, then compare with the same event definition and a relevant peer group.
Why can App Store conversion exceed 100%?
Metrics that combine total downloads and unique impressions can include redownloads and events from different populations. This is another reason to use Apple's precise definition, inspect first-time downloads separately, and avoid treating the number as a simple count of new people who saw and installed the app.
Are Apple Ads conversion benchmarks useful for organic ASO?
Only as context. Paid conversion usually starts from an ad tap and depends on query and campaign mix. Organic store metrics often start from impressions or page views. Do not judge one against the other's percentage.
Should I fix screenshots if my conversion rate is below peers?
Audit them, but do not assume they are the cause. Search relevance, ratings, price, localization, app quality, and traffic mix also affect results. Pick a falsifiable page hypothesis, test it where possible, and check downstream quality.
Bottom line
The defensible app store conversion rate benchmark 2026 is not one magic percentage. It is a defined metric, a comparable cohort, and a dated source. Use Apple's peer-group benchmarks to spot a gap. Use AppTweak's 2025 category data for market context. Keep paid, organic, and subscription funnels separate. Then test the specific page change most likely to address the weak step.
Last updated: 2026-09-23.